The most recent report on the USPS Informed Delivery (ID) Service has lots of new information that is worth your time to read. Included are updated user stats, the latest open and click-through rates, and new features. Here are some highlights that stood out to me.
1. The number of Informed Delivery (ID) subscribers is growing rapidly.
Year over year, the number of ID subscribers has grown to more than 40 million, an increase of 48%. The number of households participating has grown from 22 million to 31 million, an increase of 41%. With these numbers, ID has reached penetration of nearly one-quarter of the U.S. population. In June 2020, it had 17% saturation of U.S. households. In June 2021, this had risen to 23%.
2. More mailers are engaged in Informed Delivery “campaigns.”
As the ID subscriber base has grown, so have the number of companies choosing to participate in ID “campaigns,” or the option to add clickable ride-along images and campaign hyperlinks below the grayscale image to create a free multichannel campaign and for response and tracking. Over the last year, what the USPS calls “active mailer participation” has increased from 1,500 to 2,200, a boost of 44%. The number of cumulative completed ID campaigns has increased by 83% to a total of 103,064.
Informed Delivery is starting to hit the kind of critical mass that is truly accelerating its momentum. This matters because, while ID campaigns are free to run, they aren’t free to create. A growing user base has tipped the scales on the value of investing the time and resources to develop the ridealong images, full-color representative images (if used), and accompanying campaign landing pages.
Expect these numbers to only grow. The USPS is continuing to invest in proactive strategies to grow the Informed Delivery user base, including enabling users to sign up during online transactions across five existing USPS channels, such as “hold mail,” tracking, and Click-N-Ship.
3. Average open rates remain steady.
The average open rate for Informed Delivery Daily Digest emails is 68%. This isn’t really surprising. I mean, who doesn’t want a sneak peek at what’s coming in the mail? However, it is down from 89% just one year ago.
4. Mailers are running more “dual” campaigns than basic campaigns.
A new feature of Informed Delivery has been the ability to replace the default grayscale image of the day’s mail with a full-color “representative” digital image instead. When the USPS first enabled dual campaigns, they under-performed their grayscale counterparts. Today, dual campaigns are getting higher click through rates (1.3% vs. 1.0%), and in terms of deployment numbers, are outpacing the basic grayscale campaigns by 43% (28,899 vs. 20,200).
5. Users remain “satisfied” or “very satisfied” with the service.
Eighty-six percent of users say they are “satisfied” or “very satisfied” with the Informed Delivery service, unchanged from one year ago. I do wonder about any changes in the breakdown is between “satisfied” and “very satisfied,” however. Is the ratio of “satisfied” and “very satisfied” static the way the aggregate number is? Or is it shifting internally?
The percentage of ID subscribers saying they would recommend Informed Delivery to their family or friends did drop from 93% to 90%, after all. Is this within the standard deviation (i.e., not a statistically significant shift)? Or is there something more going on here?
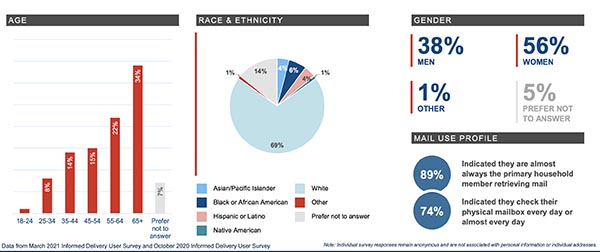
6. Informed Delivery users are primarily older, white, and female.
Is it worth investing the internal resources in creating an Informed Delivery integrated campaign? It might depend on your audience. Self-reported demographics show that ID users are overwhelmingly white (69%), over the age of 55 (55%), and female (38%). If you’re going after an audience that does not look like this, you might get less bang for the buck, so to speak.
7. Users continue to engage by email (75%) and in the morning (68%).
This knowledge can potentially impact how those campaigns are being crafted.
8. Larger companies are getting better results than smaller ones.
Smaller companies have better email open rates than large ones (65% vs. 62%), but their click-through rates are half their larger counterparts (.8% vs. 1.9%). The marketing and data insights available to larger companies are clearly helping them make more informed decisions.
9. Informed Delivery open rates have dropped.
One year ago, ID open rates were 87%. Today, they have dropped to 64%, although this is still 2.5X the industry average of 26.7%. But my question is why? I think of the other drop—from 93% to 90% of users saying they would recommend ID to friends and family. Things that make you go, “Hmmmm!”
10. Informed Delivery offers new features.
Social media sharing: ID users can share their favorite campaigns on their social media channels. The preferred channel for social sharing is Facebook, which is consistent with the older, female demographic of the audience.
Reminders: Similar to reminders in a user’s calendar app, ID users can now set reminders to act on their mail if they aren’t prepared to do it right away. Subscribers can set those reminders for up to 10 days from the time they see the digital image in their ID Daily Digest, ID dashboard, or ID mobile app.
Do more with packaging: Companies can add marketing and instructional information, alongside tracking information, with their packaging campaigns. This program was launched earlier and has moved into Phase II of the rollout.
I’d love to hear your thoughts on the new data. Does your experience (and your clients’ experience) match what you see?


Discussion
Join the discussion Sign In or Become a Member, doing so is simple and free