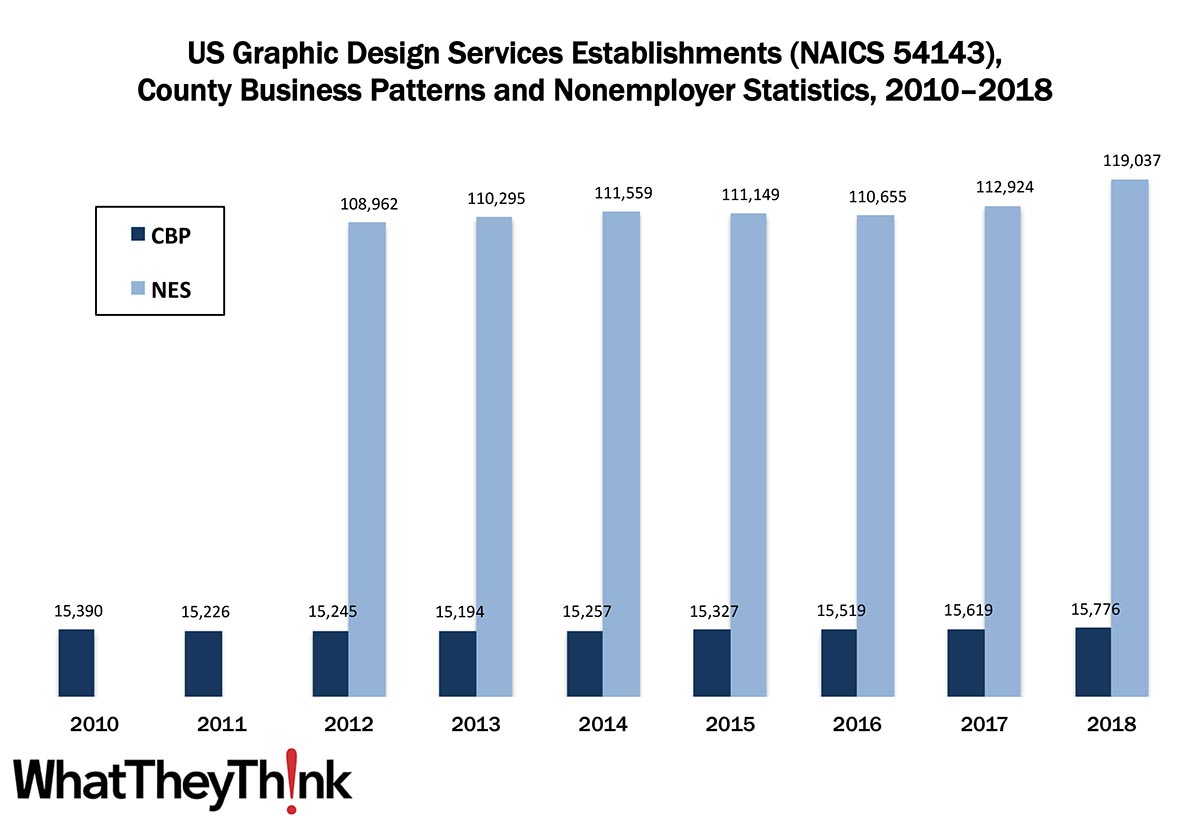
In 2010, there were 15,390 establishments in NAICS 54143 (Graphic Design Services). After something of a contraction due to the Great Recession, graphic design establishments started to grow again, peaking at 15,776 establishments in 2018, according to the latest County Business Patterns.
A substantial number of graphic design “establishments” are counted as part of the Census Bureau’s Nonemployer Statistics (NES), which are essentially freelancers or independent contractors (basically the “1099 or fight” crowd). It’s tough to get an exact count of this particular category, as Nonemployer Statistics only goes as deep as four-digit NAICS codes. NAICS 5414 (Specialized Design Services) also includes Interior Designers, Industrial Designers, and Other Specialized Designers, as well as Graphic Designers. However, we can get a ballpark figure. In 2018, County Business Patterns counted 33,651 establishments in NAICS 5414, and establishments in 54143 accounted for 47% of them. In 2018, Nonemployer Statistics counted 253,911 establishments in 5414. Taking 47% of that would indicate 119,037 freelance graphic design establishments, up +5.4% from 2017. We have thus estimated the number of NES establishments going back to 2012 (which is as far back as NES goes).
Graphic design firms haven’t been hurting establishment-wise, but over the course of the past 30 years, technology has been both their friend and their enemy. Inexpensive hardware and graphic design software really helped the graphic design sector take off in the late 1980s and early 1990s. However, technology has also been designers’ undoing, as template-driven design has let end users do their own design (albeit not always well) in programs like Word, or online using Wordpress and other template-driven applications—even on printers’ own web-to-print sites. Then of course there is “creative commoditization,” where competition-for-the-lowest bidder design sites can be serious competition to professional designers, or at the very least devalue the creative design process. As a result, graphic designers have had to expand their capabilities beyond traditional print and web design, moving into programming, rich media, video, event design (like trade shows), and other ancillary areas.
These counts are based on data from the Census Bureau’s County Business Patterns and Nonemployer Statistics, which now include 2018 data. Throughout this year, we will be updating these data series with the latest figures. Census Bureau reports include other data, as well, such as number of employees, payroll, etc. These counts are broken down by publishing business classification (based on NAICS, the North American Industrial Classification System).
These data, and the overarching year-to-year trends, like other demographic data, can be used not only for business planning and forecasting, but also sales and marketing resource allocation.
Upcoming segments in our data slice’n’dice series will include the other “creative” markets:
- 54181 Advertising Agencies
- 54182 Public Relations Agencies
- 54183 Media Buying Agencies
- 54185 Outdoor Advertising
- 54186 Direct Mail Advertising
Over time, we will be adding additional data from County Business Patterns, such as number of employees, payroll, and similar information for additional business classification of relevance to the graphic communications industry.
This Macro Moment
Yesterday, the Bureau of Economic Analysis (BEA) released an “advance” estimate of second quarter GDP. One thing’s for sure: this pandemic is making Microsoft Excel chartmaking a heck of a challenge:
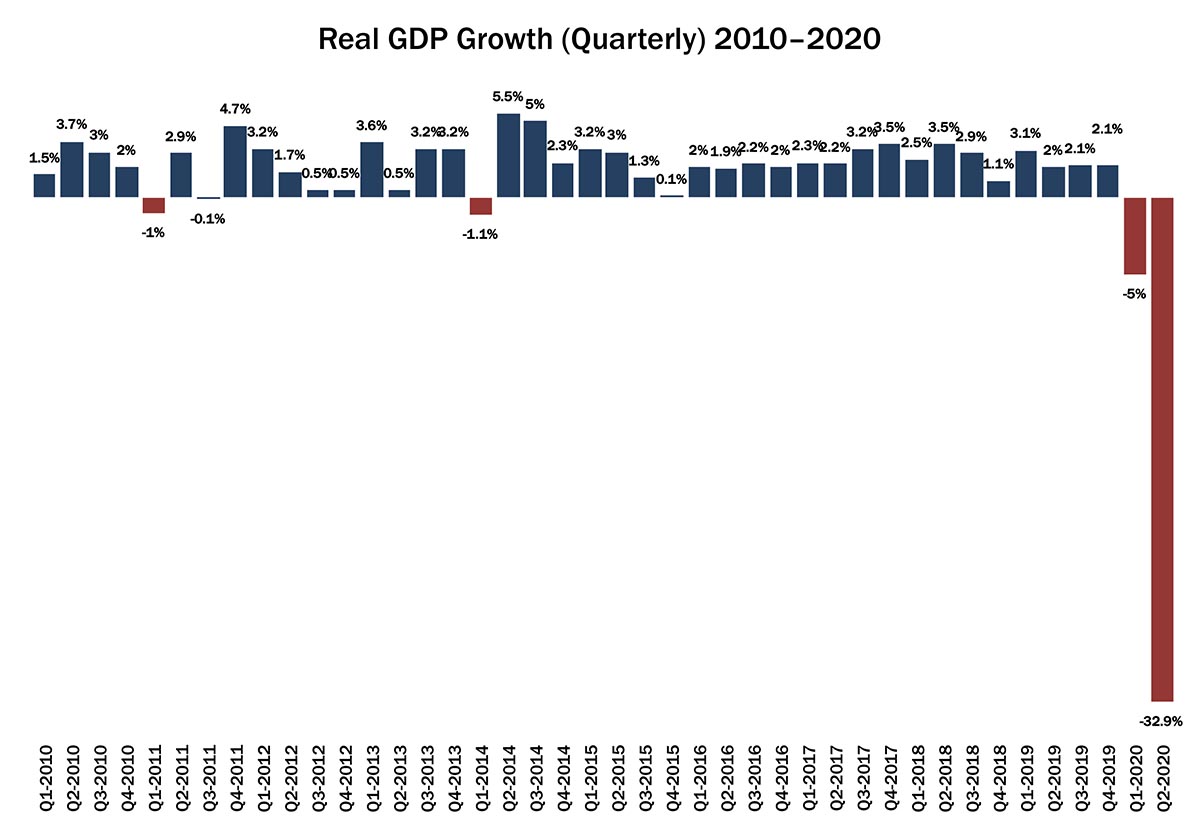
Source: Bureau of Economic Analysis
Real gross domestic product (GDP) decreased at an annual rate of 32.9 percent in the second quarter of 2020...according to the "advance" estimate released by the Bureau of Economic Analysis. In the first quarter, real GDP decreased 5.0 percent.
We were expecting this, but it’s still a bit of a shock to see it immortalized in chart form. Economists are expecting a downward revision as more data becomes available, and the “second” advanced estimate for Q2 will be released on August 27.
We should expect to see Q3 GDP improve, but as the pandemic-related shutdown altered everyone’s behavior, there will be some long-lasting, perhaps permanent, effects. The first is that if telecommuting continues for a substantial percentage of the working population, that will mean less demand for gas as workers won’t have to commute for 30, 45, 60, or even more minutes each day. That’s also less wear and tear on cars, which reduces demand for auto parts and repairs. Also, less demand for dry cleaning services or work-related clothing and shoes. (Basically if it looks good on Zoom, it’s fine.) Then there are the businesses located near office parks or other industrial centers that catered to workers—downtown restaurants, gyms, and the like that serviced people on their lunch breaks or on their way to and from work (Starbucks, e.g.). Business travel will probably not return to its once-ebullient level—some of us personally are perfectly happy with that, but business travel is a very large economic driver. All of this then affects the businesses that service these businesses—and on and on up the supply chain.
So even if we someday manage to conquer the virus, some of the new behaviors it has engendered may not be temporary, and the next few years are very likely going to see a large transformation of the US—and perhaps world—economy.


