When it comes to evaluating color, lighting is very important. Whenever we view color, in a L’Oréal magazine advertisement or a box of Lindt chocolate in the store, it is important to understand the effect of the light source. We have heard about D50 lighting and 5000 K color temperature, but what do they mean and is “daylight” actually D50? We went outside (with social distancing) and measured daylight in May in Toronto. Guess what? It really is a very good match to D50!
A customer may visit a print shop and, together with the printer, may generate an excellent sample that is approved in a press-side D50 viewing booth. However, when the customer takes the samples back to the office to show their boss, under office lighting the samples may change color and incur the wrath of the manager! Let’s see how to deal with lighting in practical applications.
There are many different ways to specify a light source using the color temperature scale, e.g. 5000 K, and also official CIE illuminants, such as Illuminant A and D50, etc. We made some real measurements of daylight, a household tungsten bulb, and a compact fluorescent lamp (CFL). It is amazing how close these are to their relevant standards.
Color Temperature (5000 K, 6500 K)
In color management, there are different ways to describe the color of a light source. A convenient method is called the color temperature scale. The idea of color temperature can be appreciated by considering the progressive heating of a piece of metal. As objects are heated, they get hotter and begin to glow and emit light. The color changes as objects get warmer, so an object goes from dull black to deep red then bright red and finally to “white hot.” It is therefore possible to describe the color of a light source by temperature. When used in this way, the temperature is called color temperature. In the color temperature scale, lower color temperatures are redder/warmer and higher color temperatures are bluer/colder.
Color temperature is measured on an absolute temperature scale and has units in degrees Kelvin (K). A tungsten source may have a color temperature of, for example, 2800 K. (No degree sign is used with K, so color temperatures are not written as 2800° K but simply 2800 K.) Typical values for common light sources are: high-pressure sodium vapor for night-time street lighting, 2100 K; photographic studio lamp, 3400 K; electronic flash, 6000 K; average daylight, 5000–6500 K; compact fluorescent lamp, 6500 K; uncalibrated computer monitor, 9300 K.
The color temperature scale provides a succinct, numerical means of specifying the color of a light source and is widely used in color measurement and color management.
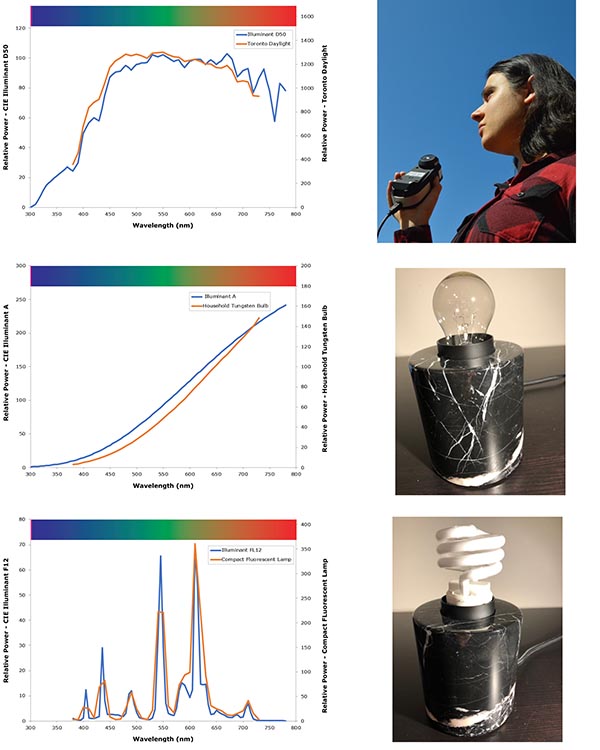
Daylight was measured in Toronto, Canada, at 9.00 a.m. on May 22, 2020, and shown to be very close to Illuminant D50. A household tungsten bulb matches Illuminant A, and a compact fluorescent lamp (CFL) is accurately described by Illuminant FL12.
Daylight Spectral Power Distribution Curves
There are many types of light sources. Some are “heated sources” like the sun or a tungsten bulb. Tungsten bulbs are incandescent materials containing a filament through which an electric current is passed, causing the element to get hot and radiate light. Daylight that originates from a hot glowing sun is also essentially incandescent. Incandescent sources have a graph with a continuous, relatively smooth line.
Other sources, such as compact fluorescent lamps are not heated up and therefore do not operate this way. These lights contain a gas that is excited by the discharge of an electric current, which in turn excites the phosphor coating of the tube, which glows, giving off light. The chemical composition of the coating can be altered to adjust the color temperature of the emitted light, so you can get Daylight (5000 K), Soft White (2700 K), Warm Glow (2200 K) etc. at Home Depot.
The different operating principles results in a variation in the characteristics of the light. The Kelvin color temperature scale does not fully reveal all the characteristics of the light so we can also use a spectral distribution curve. This spectral graph describes the relative amount of power or energy at each wavelength and is technically known as a spectral power distribution curve.
By using spectral graphs we can clearly see the smooth continuous nature of some sources (daylight and tungsten) vs. the spiky response of others (compact fluorescent lamps). The spiky nature of fluorescent sources can cause metamerism when these sources are used in viewing booths.
CIE Illuminants (Illuminant A, D50)
With so many different types of light sources in everyday use, a few common light sources have been chosen and adopted as universally accepted standards. Periodically over the years, in response to user needs, the Commission Internationale de l’Eclairage (CIE) agrees on the name and specification of an illuminant and publishes the spectral graph for the color community to use.
A CIE illuminant is a theoretical spectral power curve that has been established as a standard. The spectral curve can be an average of light sources and is not a real, actual light source. There are physical references for other standards, such as a kilogram gold bar in a vault in Paris, but a CIE illuminant is just a theoretical construct; it is simply a spectral graph.
Over the years, the CIE has defined a number of illuminants that range conveniently in letters A, B, C, D, E, F. Illuminant A is represented by incandescent lights (tungsten filament bulbs). These devices have a color temperature of 2856 K. Illuminants B and C are daylight-type illuminants, but they are no longer in general use. They were made by placing a liquid cell containing a blue copper sulphate solution in front of illuminant A. D illuminants are daylight-type illuminants. Illuminants D50, D55, D65, and D75 have color temperatures of 5000 K, 5500 K, 6500 K, and 7500 K, respectively. D50 and D65 are widely used as illuminants in printing and imaging. European countries often use D65. Illuminant E is an imaginary, hypothetical equi-energy illuminant. Illuminant E consists of equal power per wavelength across the visible spectrum—that is, the spectral power distribution curve is a horizontal line for use in color computations. Series F illuminants relate to fluorescent lights.
It should be noted that the spectral power distributions for an illuminant, Illuminant D50 for example, is an average and any actual sample of daylight, might be different according to the geographic location, altitude, weather, time of day, and so on. But how well do the standards match reality?
For this article, a number of real sources were measured and compared to D50, Illuminants A and FL12, using an X-Rite i1Pro2 spectrophotometer with a diffuser cap. It is remarkable how close real measurements can be, compared to the corresponding CIE illuminants. The graphs of Illuminant vs. measurement can be compared using a metric called the Color Rendering Index (CRI).
Lighting and Light Booths
If somebody holds up a print and says they do not like the colors, the first thing to do is ask them how are they viewing the print? If color measurement for the print was done with settings that intended viewing for D50 (5000K), the sample should be viewed under D50. The print is only intended for a specific viewing condition and may look different under other light sources. Another way to think of this is that if you have sent a print to your client and you want them to see what you see; they must view the print under the conditions you viewed and measured it under.
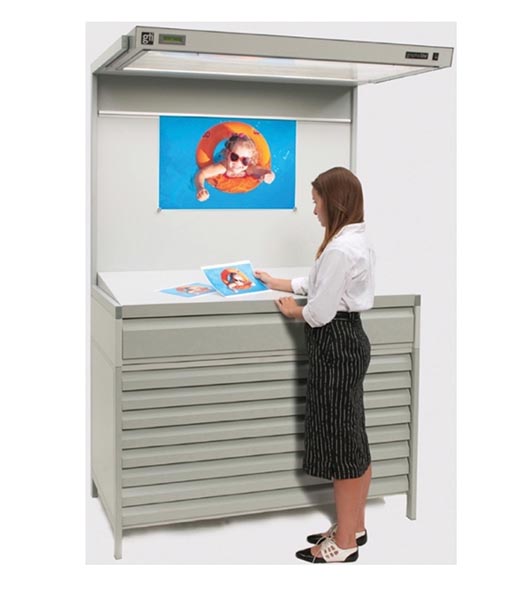
Viewing booths are used to create standard viewing conditions and are a vital part of a color management system. North American manufacturer GTI’s EVS-3052 model shown here. Image courtesy GTI.
One way to create well specified and controlled viewing conditions is to use a viewing booth. Viewing booths have switches that offer D50, D65, or other illuminant conditions, such as settings for grocery store or clothing store lighting.
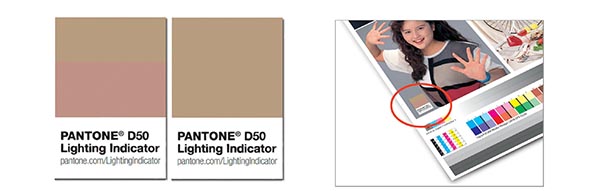
In the PANTONE® D50 Lighting Indicator, the top and bottom halves are different in non-D50 lighting, but match in D50 lighting. The 2-inch sticker can be attached to color proofs to check the lighting.
In printing and proofing, the light source used by the customer can be checked using the PANTONE D50 Lighting Indicator. In this small label, the top and bottom materials are different, but are chosen in such a way that they will look alike under D50 illumination. The sticker can be placed in the corner of a contract proof used to gain customer approval. The sticker will show whether the proof is being viewed under lighting that approximates D50. There is a D50 (and D65) version of the sticker which cost around $1.50. The Lighting Indicator is based on metamerism, and the top and bottom materials are called a metameric pair.
Summary
We need to always remember that lights themselves have a color and that color can be passed on to the sample. Strictly speaking, there is no correct light source for evaluating color. What is more important is that we know the light source we are using, and we communicate that clearly to all involved. It is extremely important to establish standard viewing conditions for the printer and the customer.
I have been doing color management for many years now, but with time on my hands due to coronavirus, this is the first time I measured real light sources and was amazed at the results. Color science really works!


Discussion
Join the discussion Sign In or Become a Member, doing so is simple and free